 Spring 2021
 Decision-making Simulation: Checkout Lines
The main purpose of this project is to use your Queue implementation to simulate shoppers picking a check-out line at a large store. We'll use the simulation to compare the performance of three different algorithms for selecting a queue. For example, if you are checking out at a big box store, there may be 20 queues open. How do you optimize your choice?
It turns out this question is also relevant to sending packets over a network via different paths.
You will implement and investigate the effectiveness of at least three strategies for choosing a queue:
- Select the shortest queue. This may seem optimal, but in practice that takes a lot of work, and by the time you're done examing the length of each queue, the situation may have changed.
- Pick a queue at random. This has the advantage of taking very little time to choose a queue, but following a random strategy means you may end up at the end of the longest queue, standing next to a short queue.
- Pick two queues randomly and then join the shorter queue. This strategy is studied in (Mitzenmacher, The Power of Two Choices in Randomized Load Balancing, TPDS, 2001). The pick two random strategy may be able to take advantage of the strengths of both earlier strategies, but it may still mean you end up in a long queue next to a short queue.
Problem Description
Implement a simulation of a multi-station checkout situation. Once you have your simulation working, compare the three strategies given below for customers selecting a checkout line.
- Randomly select one checkout line.
- Scan all of the checkout stations and pick the shortest checkout line.
- Randomly select two checkout lines. Of the two, pick the one with the shortest line.
The classes you will implement for this project include the following
- Customer: A customer has a set of items that need to be paid for and a counter to keep track of how many time-steps it takes for them to choose a line and paid for all of the items. Each customer will also have a strategy for choosing a line.
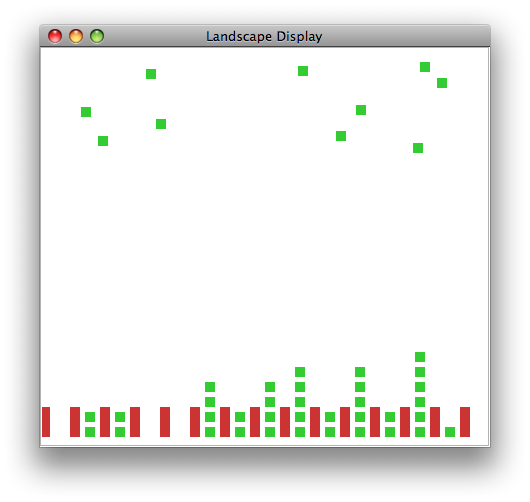
- CheckoutAgent: Each CheckoutAgent will maintain a queue of Customers. At each time-step, then Checkout Agent will either remove an item from the customer at the head of the queue, or, if the customer has no more items, remove the Customer herself from the queue. The CheckoutAgent will be displayed graphically as a tall rectangle, which its height reflecting the number of Customers in the queue.
- Landscape: The Landscape will maintain a list of CheckoutAgents as well as a list of Customer's who have paid for all of their goods. The Landscape will report statistics summarizingthe amount of time if took for the Customer's to pay for all of their items.
- LandscapeDisplay: As in previous projects, the LandscapeDisplay contains the graphics code that allows the Landscape's agents to be drawn.
- RandomCustomer: This will extend the Customer class and implement the random line-choosing strategy.
- Pick2Customer: This will extend the Customer class and implement the strategy in which the customer randomly chooses two lines, then joins the shorter of those two.
- PickyCustomer: This will extend the Customer class and implement the strategy in which the customer chooses to join the shortest queue.
- RandomCustomerSimulation, Pick2CustomerSimulation, PickyCustomerSimulation: These are the main programs that run simulations with the given type of Customer.
Tasks
Customer Class
The Customer class should be an abstract class with private fields to keep track of how many items remain in her basket (an int) and the number of time steps it takes for her to leave the store (also an int). Ultimately, we will derive three classes from this class, each of which will implement one of the line-choosing methods. This class defines the data common to all customers and mandates a particular form for the line-choosing method.
The Customer class should implement the following methods
public Customer(int num_items)constructor method. (By default, the number of time steps is zero.)public Customer(int num_items, int time_steps)constructor method.public void incrementTime()increments the number of time steps.public int getTime()returns the number of time stepspublic void giveUpItem()decrements the number of items (indicating another item has been paid for).public int getNumItems()returns the number of items.public abstract int chooseLine(ArrayList<CheckoutAgent> checkouts);since this is an abstract method, there is no body.
CheckoutAgent Class
The CheckoutAgent class should have fields for its x- and y-positions (ints) (so it can be drawn) and a queue of Customers (MyQueue<Customer>). It should implement the following methods:
public CheckoutAgent(int x, int y)constructor. The queue should be initialized to an empty MyQueue<Customer>.public void addCustomerToQueue( Customer c )add a Customer to its queue.public int getNumInQueue()returns the number of Customers in its queue.public void draw(Graphics g)draws the CheckoutAgent as a rectangle near the bottom of the window with a height proportional to the number of Customers in the queue. A height of 10*N (where N is the number of customers in the queue) and width of 10 should work. Assume that (this.x,this.y) is the bottom left corner of the rectangle.One non-obvious issue is that when using the drawRect function, the first two arguments are the upper left corner of the rectangle, and the last two arguments are the width and height of the rectangle. Therefore, if you want the bottom of the rectangle to stay fixed and have the rectangle appear to grow up, then you have to move the upper left corner up as the rectangle grows. If this.getY() is the lower left corner y value, then the upper left corner y-value needs to be this.getY() - desired_height.
Landscape Class
The Landscape Class should have fields for the width and height (ints) (for the purposes of drawing), an ArrayList<CheckoutAgent> to hold the list of checkout agents, and a LinkedList<Customer> to hold the Customers who have completed checking out. Use the LinkedList class you implemented last week to hold the Customers. The Landscape class should implement the following methods.
public Landscape(int w, int h, ArrayList<CheckoutAgent> checkouts )constructor. The list of finished customers should be initialized to an empty list.public int getHeight()return the height of the Landscape.public int getWidth()return the width of the Landscape.public String toString()return a string indicating how many checkouts and finished customers are in the landscape.public void addFinishedCustomer(Customer c )add the Customer to the list of finished customers.public void draw( Graphics g )loop through the CheckoutAgents, calling the draw method on each.
RandomCustomer Class
The RandomCustomer class should extend the Customer class because a RandomCustomer is a Customer, just a Customer with a particular strategy for choosing a checkout queue to join. The RandomCustomer class should implement the following methods:
public RandomCustomer( int num_items )constructor. This should call the super class's constructor with the given number of items and 1 as the initial value for the time steps. This is meant to simulate the amount of time the RandomCustomer spends choosing a line. The RandomCustomer spends one time-step choosing a line, so it needs to start its counter at 1.public int chooseLine(ArrayList<CheckoutAgent> checkouts)returns an integer randomly chosen from the range 0 (inclusive) to the lenght of the list (exclusive).
Landscape Visualization
Visualize your Landscape with the checkout queues. Download the LandscapeDisplay.java file. It is almost identical to last week.
Test your visualization by running LandscapeDisplay as your main program. The main program generates a random number of Customers (between 1 and 5) for each of 5 CheckoutAgents, adds them to the Landscape, and then displays them.
Testing RandomCustomer.chooseLine
Test your RandomCustomer by downloading and running TestRandomCustomer.java. It generates 99 RandomCustomers and visualizes how they are added to 5 CheckoutAgents. Think about what visualization you expect to see, then make sure the output matches.
PickyCustomer Class
The PickyCustomer class should extend the Customer class and should implement the following methods:
public PickyCustomer( int num_items, int num_lines )constructor. This should call the super class's constructor with the given number of items and num_lines as the initial value for the time steps. The PickyCustomer examines the lengths of all the lines before choosing one, so its initial time needs to reflect that.public int chooseLine(ArrayList<CheckoutAgent> checkouts)returns the index of the CheckoutAgent with the shortest line.
Test your PickyCustomer by downloading and running TestPickyCustomer.java. It generates 99 PickyCustomers and visualizes how they are added to 5 CheckoutAgents. Think about how this visualization should be similar to or different from the visualization with RandomCustomers. Does it meet your expectations?
Pick2Customer Class
The Pick2Customer class should extend the Customer class and should implement the following methods:
public Pick2Customer( int num_items )constructor. This should call the super class's constructor with the given number of items and 2 as the initial value for the time steps. The Pick2Customer spends two time-step choosing a line because it randomly examines two lines before picking one.public int chooseLine(ArrayList<CheckoutAgent> checkouts)returns the index of the shorter of two randomly chosen queues. (Note: write your code to ensure that there are two different lines chosen.)
Test your Pick2Customer by downloading and running TestPick2Customer.java. It generates 99 Pick2Customers and visualizes how they are added to 5 CheckoutAgents. Think about how this visualization should compare to those with the RandomCustomers and PickyCustomers. Does it meet your expectations?
Simulation
To move the Customers through the queue, the CheckoutAgent will update its state at every time step. Implement the method public void updateState( Landscape scape ). It should do the following.
- Loop through the Customers in its queue, calling
incrementTime - Examine the Customer at the front of the queue. If there is no Customer (it is null), then there is nothing more to do. Otherwise, call the
giveUpItemmethod on the Customer in the front of the queue. If the Customer then has 0 items, remove it from the queue and have the Landscape add it to its list of finished Customers.
Add a method public void updateCheckouts() to the Landscape class. It should loop through all of the CheckoutAgents, and call updateState.
Make a new class RandomCustomerSimulation that is modeled after TestRandomCustomer. All you need to do is add a call to the updateCheckouts in the main loop. Add it just after you add a customer to a queue. Run the simulation to determine whether or not it performs as expected. Fix any bugs.
Write PickyCustomerSimulation and Pick2CustomerSimulation classes to perform simulations with the remaing two Customer classes.
Evaluate the strategies
The test code that you adapted for your simulation gives each Customer 1 to 10 items. If your code is working correctly, you should see that the lines grow over time, i.e. that 1 to 10 items is too many. Adjust the maximum number of items to find a situation in which the queues don't grow over time. In your report, include an image showing the lines grow too long with too many items per Customer and another showing short lines with a more manageable number of items per Customer. In the description of each image, be sure to include the ranges that you used to create that image. Complete the remaining tasks with this new, smaller number.
Add a method public void printFinishedCustomerStatistics() to the Landscape to compute and print the average and standard deviation of the time-to-leave for all of the Customers in the finished customer list.
Run each simulation with lots of customers (at least 1000) and print out the statistics periodically, such as once every 100 time steps.
In your report, include a summary of your results, explicitly comparing the performance of the three strategies.
Extensions
The following are some suggested extensions. You should feel free to pursue your own custom extensions to your project that you find interesting. Please clearly identify your extensions in your report. In your code, make sure the baseline simulations run properly. Making a separate sub-folder for major extensions is recommended.
- Try other strategies for checking out, such as choosing a line based on how many items are in the line (rather than how many customers). Be sure to choose an initial time-step value that reflects the amount of time it would take to make the line choice. The item-counting example should take signficantly more time steps than the one that chooses the shortest line.
- Make the simulation visually interesting or more informative (such as showing how many items each Customer has).
- Analyze different aspects of the performance. For example, keep track of the average line length. Another idea is to see if the amount of time a Customer spends in line is related to the number of items they have.
- Allow each agent to choose one of the three strategies randomly. Then calculate the statistics for each strategy in the mixed situation. Which strategy does the best in a mixed situation?
- For any assignment, a good extension will be to implement a Java class that you have't implemented in the past projects and demonstrate that it has the same functionality as the Java class.
- Re-implement your Queue using an array-based method instead of a Node-based method and show the functionality is identical.
Report
Your intended audience for your report are your peers not in the class, but who have taken a CS course. Your report should explain the core CS concept used, present the results of your program, and discuss the meaning of the results: what did you discover and does it make sense?
Your project report should contain the following elements. Please include a header for each section.
- Abstract
A brief summary of the project, in your own words. This should be no more than a few sentences. Give the reader context and identify the key purpose of the assignment. Each assignment will have both a core CS purpose--usually a new data structure--and an application such as a simulation or analysis.
Writing an effective abstract is an important skill. Consider the following questions while writing it.
- Does it describe the CS concepts of the project (e.g. writing well-organized and efficient code)?
- Does it describe the specific project application?
- Does it describe the data structure you used?
- Does it describe the results of your simulation or analysis?
- Is it concise?
- Are all of the terms well-defined?
- Does it read logically and in the proper order?
- Results
Present your results. Include text output, images, tables, graphs, or qualitative descriptions, as appropriate. Include a discussion as to whether the results make sense and what they mean. For this week, include at least one animated gif or video of the simulation and a report of the customer check-out time statistics. Graphs are better than pure text! But all images (all results of any kind, really) should be interpreted for your audience in accompanying text.
- Extensions
Describe any extensions you undertook, including text output, graphs, tables, or images demonstrating those extensions. If you added any modules, functions, or other design components, note their structure and the algorithms you used.
- Reflection
A brief (1-3 sentences) description of what you learned. Think about the answer to this question in terms of the stated purpose of the project. What are some specific things you had to learn or discover in order to complete the project?
- References/Acknowledgements
A list of people you worked with, including TAs and instructors. Include in that list anyone whose code you may have seen, such as those of friends who have taken the course in a previous semester.
Handin
Here's a checklist of everything you should do when you are finished with a project and are ready to turn it in.
+ Create a report and export to pdf
- Create a report in your favorite document application (Microsoft Word, Google Doc, Libre Writer). Make sure to have all the sections described above.
- Print to PDF (Windows)
- Open a file in a Windows application.
- Choose "File > Print".
- Choose "Adobe PDF" as the printer in the Print dialog box.
- Click Print. Type a name for your file, and click Save.
- Print to PDF (Mac OS)
- Open a file in a Mac OS application.
- Click the "PDF" button and choose "Save As Adobe PDF".
- Choose the "Adobe PDF Settings" and click "Continue".
- Type a name for your file, and click "Save".
- Export to PDF Google Drive
- Choose "File" > "Download" > "PDF Document (.pdf)"
+ Organize your project folder
- In Finder, move your lab folder inside your project folder. For example, if you have
Lab05andproject_05folders both on your Desktop, drag theLab05folder insideproject_05.
+ Submit your project on Google Drive
- On Google Drive, locate the folder named with your Colby username that was shared with you earlier.
- Upload the relevant files into the matching project folder. you can ‘drag and drop’ the files into the project folder on Drive. (".class" files are not relevant)
- Note that once the files are copied, Google drive records submission time and any changes made. No further changes are allowed unless you want to make another submission.
- Submission checklist:
1- Your report should be in PDF.
2- Add your lab folder should be in your project Folder.
3- Your project and lab files are in the relevant directory in your working directory. Your working directory is the Google Drive folder with your name that I shared with you earlier.
4- The rubric is in your project directory and your name is added to the top row.