CS 151 Fall 2026 Syllabus Labs/Projects
Project 7: Data Visualization
The goals of this project are to practice:
- essential string operations, such as reading and writing to text files (file IO), concatenation, and escape sequences.
- top-down design to break a problem into manageable parts.
- using compound conditional statements.
Tasks
0. Setup
Create a Project07 folder on your computer where you store CS151 projects and labs, hopefully somewhere that is backed up (e.g. in Dropbox, Google Drive, Microsoft OneDrive, etc.)
Open up a Terminal and change the directory (cd) to the Project07 folder.
Create a new file called data_transforms.py.
Download the file example.csv.
PROJECT REQUIREMENT: To receive full credit for this project you can only use concepts, control structures, syntactic features, and libraries covered in class.
1. File Processing
First we need to write a function that takes a CSV file, reads it, and organizes the data into a format so that we can graph it.
Write a new function called process_file that takes in the parameter filename. The function creates and returns 2 lists, a list of headers, and a list of lists representing the data.
The function should:
- Open the file specified by the filename parameter.
- The first line of the file is the column headers with commas in between each header. Create a list of strings representing the column headers called
headers. There should not be any white space at the beginning or end of each string in the header list. - Loop through the remaining lines of the file using a while loop (reading line-by-line) to construct a list of lists
datarepresenting the data in the file. - For each subsequent line:
- Each line contains a row of data, with a comma between each item. Convert it into a list of floats representing the row of data.
- Append each sublist to your
datavariable.
- Return a tuple containing (headers, data).
TEST YOUR CODE PART 1: Download the file test_process_file.py. Put it in the same folder as data_transforms.py and example.csv. Run the script python3 test_process_file.py in your terminal. Do not move on to the next part of the project until it prints 5 tests, each test should say "True".
2. Feature Scaling
In data science and statistics, datasets often contain columns with vastly different units or scales (e.g., age vs. annual income). Min-Max Normalization rescales features so that every value falls between0.0. and 1.0. The mathematical formula for min-max normalization on a value x in column X is:
2a. Find the minimum and maximum
Add the minmax function to data_transforms.py:
def minmax(data):

    '''Finds the minimum and maximum values for each column across a 2D data list.

    PARAMETERS:
        data - list of lists (2D list of floats/ints)

    RETURNS:
        minimum - list containing the minimum value of each column
        maximum - list containing the maximum value of each column
    '''
    pass
Your function should perform the following operations:
- Initialize minimum and maximum lists using a deep copy of the first row.
- Iterate through every row in data.
- Compare each element against the current stored minimum and maximum for that column, updating them when smaller or larger values are encountered.
- Return minimum and maximum.
TEST YOUR CODE:
Add a main function that calls process_file("example.csv"). Call minmax with the data returned from process_file(). Print the minimum list and the maximum list. Call your main function in your main guard. Compare the values printed to the expected outputs below.
Minimum [0.0, 0.0, 2.0]
Maximum [1.0, 49.0, 99.0]
2b. Normalize Columns
Add the normalizeColumns function to data_transforms.py:
def normalizeColumns(data):

    '''Normalizes all values in a 2D list to the range [0.0, 1.0].

    PARAMETERS:
        data - list of lists (2D list of floats/ints)

    RETURNS:
        normalizedData - 2D list of scaled float values
        minimum - list of minimum values per column (from minmax)
        maximum - list of maximum values per column (from minmax)
    '''
    pass
Your function should perform the following operations:
- Call your minmax function to retrieve the extremes of each column.
- Construct a new list of lists
normalized_cols, where each column ofdatahas been normalized based on the minimum and maximum of that column, using the formula above. - Return the
normalized_cols(a 2D list the same size asdata),minimumlist andmaximumlist.
TEST YOUR CODE:
In your main function call normalizeColumns with the data returned from process_file() as the argument. In main print the first row and the last row of normalizeColumns. Call your main function in your main guard. Compare the values printed to the expected outputs below. Do they look similar?
First Row [1.0, 0.0, 0.26804123711340205]
Last Row [0.0, 1.0, 0.6494845360824743]
3. Graphing
The goal of this portion of the code is to be able to graph the data.
3a. Setup
Create a new file called data_visualization.py.
Import data_transforms.py.
Import only the Turtle class and Screen class from the turtle library.
Copy your goto function from Project 4, as well as the rectangle function from Project 3. Update your rectangle function to have an additional parameter turt (a turtle object), and modify the function to draw using the turt parameter.
3b. Create Screen and Turtle
Create a main function that:
- Create screen object and assign it to a variable.
- Sets the tracer to 0, so there is no animation.
- Setup the screen to have a width of 550 and height of 550.
- Creates a turtle object that will be used to draw the graph and assign it to a variable.
- Hide the turtle and have it pick up it's pen.
- Call
process_file("example.csv")fromdata_transforms. - Call
normalizeColumnswith the data returned fromprocess_file()as it's argument. - At the end of the function, update the screen and call the screen method exitonclick.
main function in your main guard. If you run your code you should have a screen appear that is 550 x 550, which stays open until you click on it.
3c. Create a Scatterplot
Create a scatterplot function that has the following parameters:
- A turtle object for drawing
- The normalized data list (returned from normalizeColumns)
- The minimum list (returned from normalizeColumns)
- The maximum list (returned from normalizeColumns)
- The headers list (returned from process_file)
- The index of the columns that will be plotted on the x axis
- The index of the columns that will be plotted on the y axis
- The index of the columns that will be control the color of the point
- The plotsize, with the default argument 400.
The scatter plot should:
- Create a square that has the width and height plotsize with its center at 0,0.
- Graph the normalized data inside the square with 0,0 at the lower left hand corner and 1,1 a the upper right hand corner.
- Set the shape of the turtle to be a circle and it's size to be .2.
- For each row of the data, move the turtle to the correct location using the item in the row associated with the x column for the x position and the item in the row associated with the y column for the y position. Set the color of the turtle based on the item in the row associated with the color column. Stamp the turtle. Remember to scale and center the x and y values based on the size of the plot.
- Add an x-axis.
- Beneath the plot in the lower left hand corner write the minimum value associated with the x column.
- Beneath the plot in the lower right hand corner write the maximum value associated with the x column.
- Beneath the plot in the center write the header associated with the x column.
- Add a y-axis.
- To the left of the plot in the lower left hand corner write the minimum value associated with the y column.
- To the left of the plot in the upper left hand corner write the maximum value associated with the y column.
- To the left of the plot in the center write the header associated with the y column.
3d. Add Command Line Arguments
Modify your code so that it uses command line arguments and then use them to control aspects of the plot. The file should expect the following command line arguments:
- filename: a string representing the csv file to import
- x_index: an integer representing the column to plot on the x-axis
- y_index: an integer representing the column to plot on the y-axis
- color_index: an integer representing the column to use to determine the color of the point.
TEST YOUR CODE: Download breast-cancer.csv. Call your code with the following command. python3 data_visualization.py breast-cancer.csv 2 3 1 This should produce a new plot. Take a screen shot of your plot. This is required image 2.
Check reproducibility
In order to grade your project, we need to be able to run your code and get the same results as you do! In your project submission ZIP file, please include any PPM images that are needed run your code (including example.csv and breast-cancer.csv).
Here is a summary of the expected outputs from each of the source code files that you created:
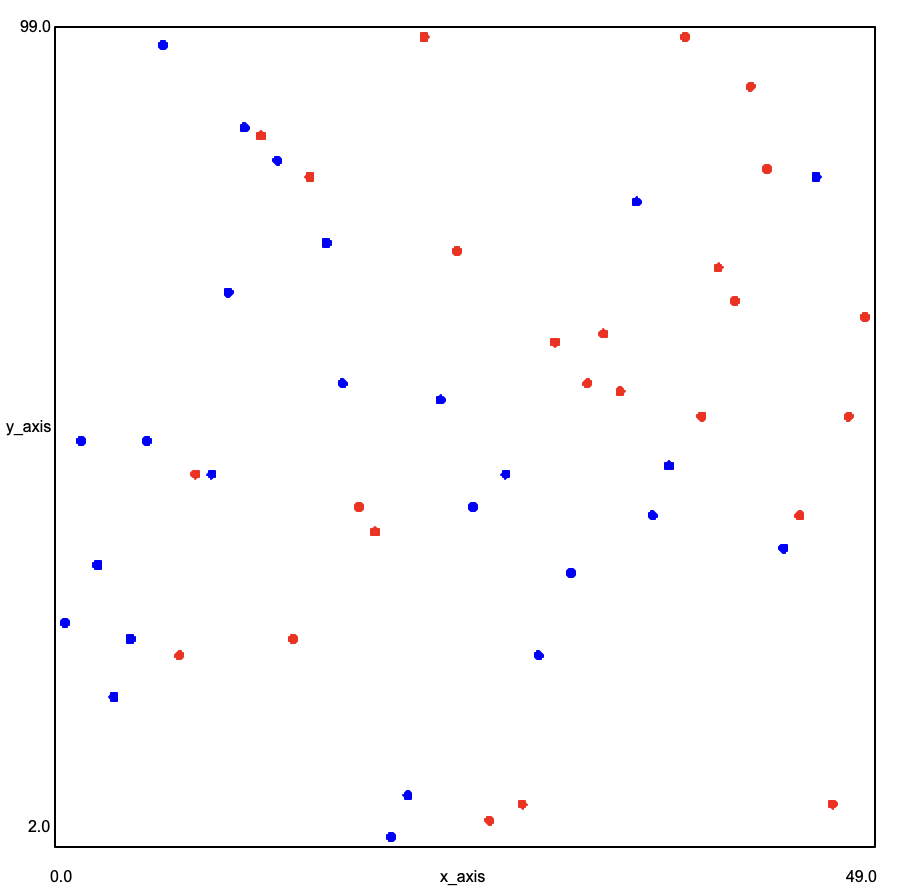
python3 test_process_file.py: This file should print out the results of the 5 tests, all of which should be True.python3 data_transforms.py: This file should print out information aboutexample.csv. The minimum of each column, the maximum of each colulm, the first row of the data normalized and the last row of the data normalized.python3 data_visualization.py: This should print a usage statement.python3 data_visualization.py <filename> <x_index> <y_index> <color_index>: This command should plot data from the csv file specificed through the command line argument filename. The x_index should control which axis is graphed on the x axis and the y_index should control which axis is graphed on the y axis. The color_index should control what color each point is.python3 data_visualization.py example.csv 1 2 0: This command should reproduce the image at the top of this project.python3 data_visualization.py breast-cancer.csv 2 3 1: This command should produce required image 2.
PROJECT REQUIREMENT: To receive full credit for this project you can only use concepts, control structures, syntactic features, and libraries covered in class.
If you use command-line arguments, please explain what they are and provide an example way to run your code in your report.
AI Usage Statement
Document your AI usage in the format described here under "AI Usage Statement" OR if you didn't use AI answer the following question. The question should be answered in a short paragraph (100-250 words total) without using AI and take approximately 10-20 minutes to complete, including researching and writing.
Alternative Assignment: Find a specific example of Dynamic Pricing and a company that provides the service. Research and explain an underlying component of the technology, computational method or machine learning model used, be as specific as possible. Describe a potential issue for a company with using dynamic pricing, and how your specific example does or does not address it. Include at least one cited credible source (academic paper, official tech documentation, or reputable technical news outlet).
Extensions
Congratulations on completing the core tasks! If your code and report meet the above expectations, you’ve already earned up to 27/30 points for this project.
The remaining 3/30 are a chance for you to earn credit for exploring parts of this project and digging deeper to express your creativity! This is entirely optional; 27/30 is an A- and is a perfectly respectable place to stop. Extensions are open-ended and exist to compliment the structured core project. Explore and learn something new that interests you! Concentrating your energy on 1-2 "deep" extensions that challenge you will earn you more points than many small, "shallow" extensions.
You can pick your own topics that interest you. Here are a few examples:
- Add x and y axis ticks. (.5pt each axis)
- Add a legend to your plot. (.5pt)
- Adjust your code so your plot can be drawn at any location at any scale. Write a function that draws multiple plots, each showing different data. (1-1.5pts)
- Write a function that draws a histogram plot, using data from a csv file. (1.5pts)
- Write a function that draws a line graph with multiple lines of data, using data from a csv file. (1.5pts)
- Explore the breast cancer dataset. Through creating more graphs and interpreting them, what can you conclude from this dataset. (.5-1pt)
- Find your own dataset, import it using python and graph a portion of the data. Interpret the results of the graph in your report. (1-1.5pts)
Submission checklist
To turn in your project, make sure you do all of the following:
- Check the rubric in Google Classroom and make sure your report and code contain all the required parts.
- Move your lab folder inside your project folder (i.e. drag the
Lab07folder insideProject07). - Rename your project folder to include your Colby username. For example, I would name mine
hewolfe_Project7.zip. - Create a zip file of your project.
- Attach (drag) the zip file to the posted project assignment on Google Classroom.
- Click "Turn In" on the Project 7 assignment in Google Classroom.